Basic workflow: enb.atable.ATable
This page explains the most basic workflow with enb with a
simple example.
In this example, enb.atable.ATable is subclassed to gather some statistics about a text corpus.
You can look at the sources in that link, or install a self-contained version with:
enb plugin install basic-workflow bw
Then, classes from the enb.aanalysis module are used to summarize and plot the obtained results.
A diagram depicting these main stages is shown next. These stages are addressed
one by one in the remainder of this page.
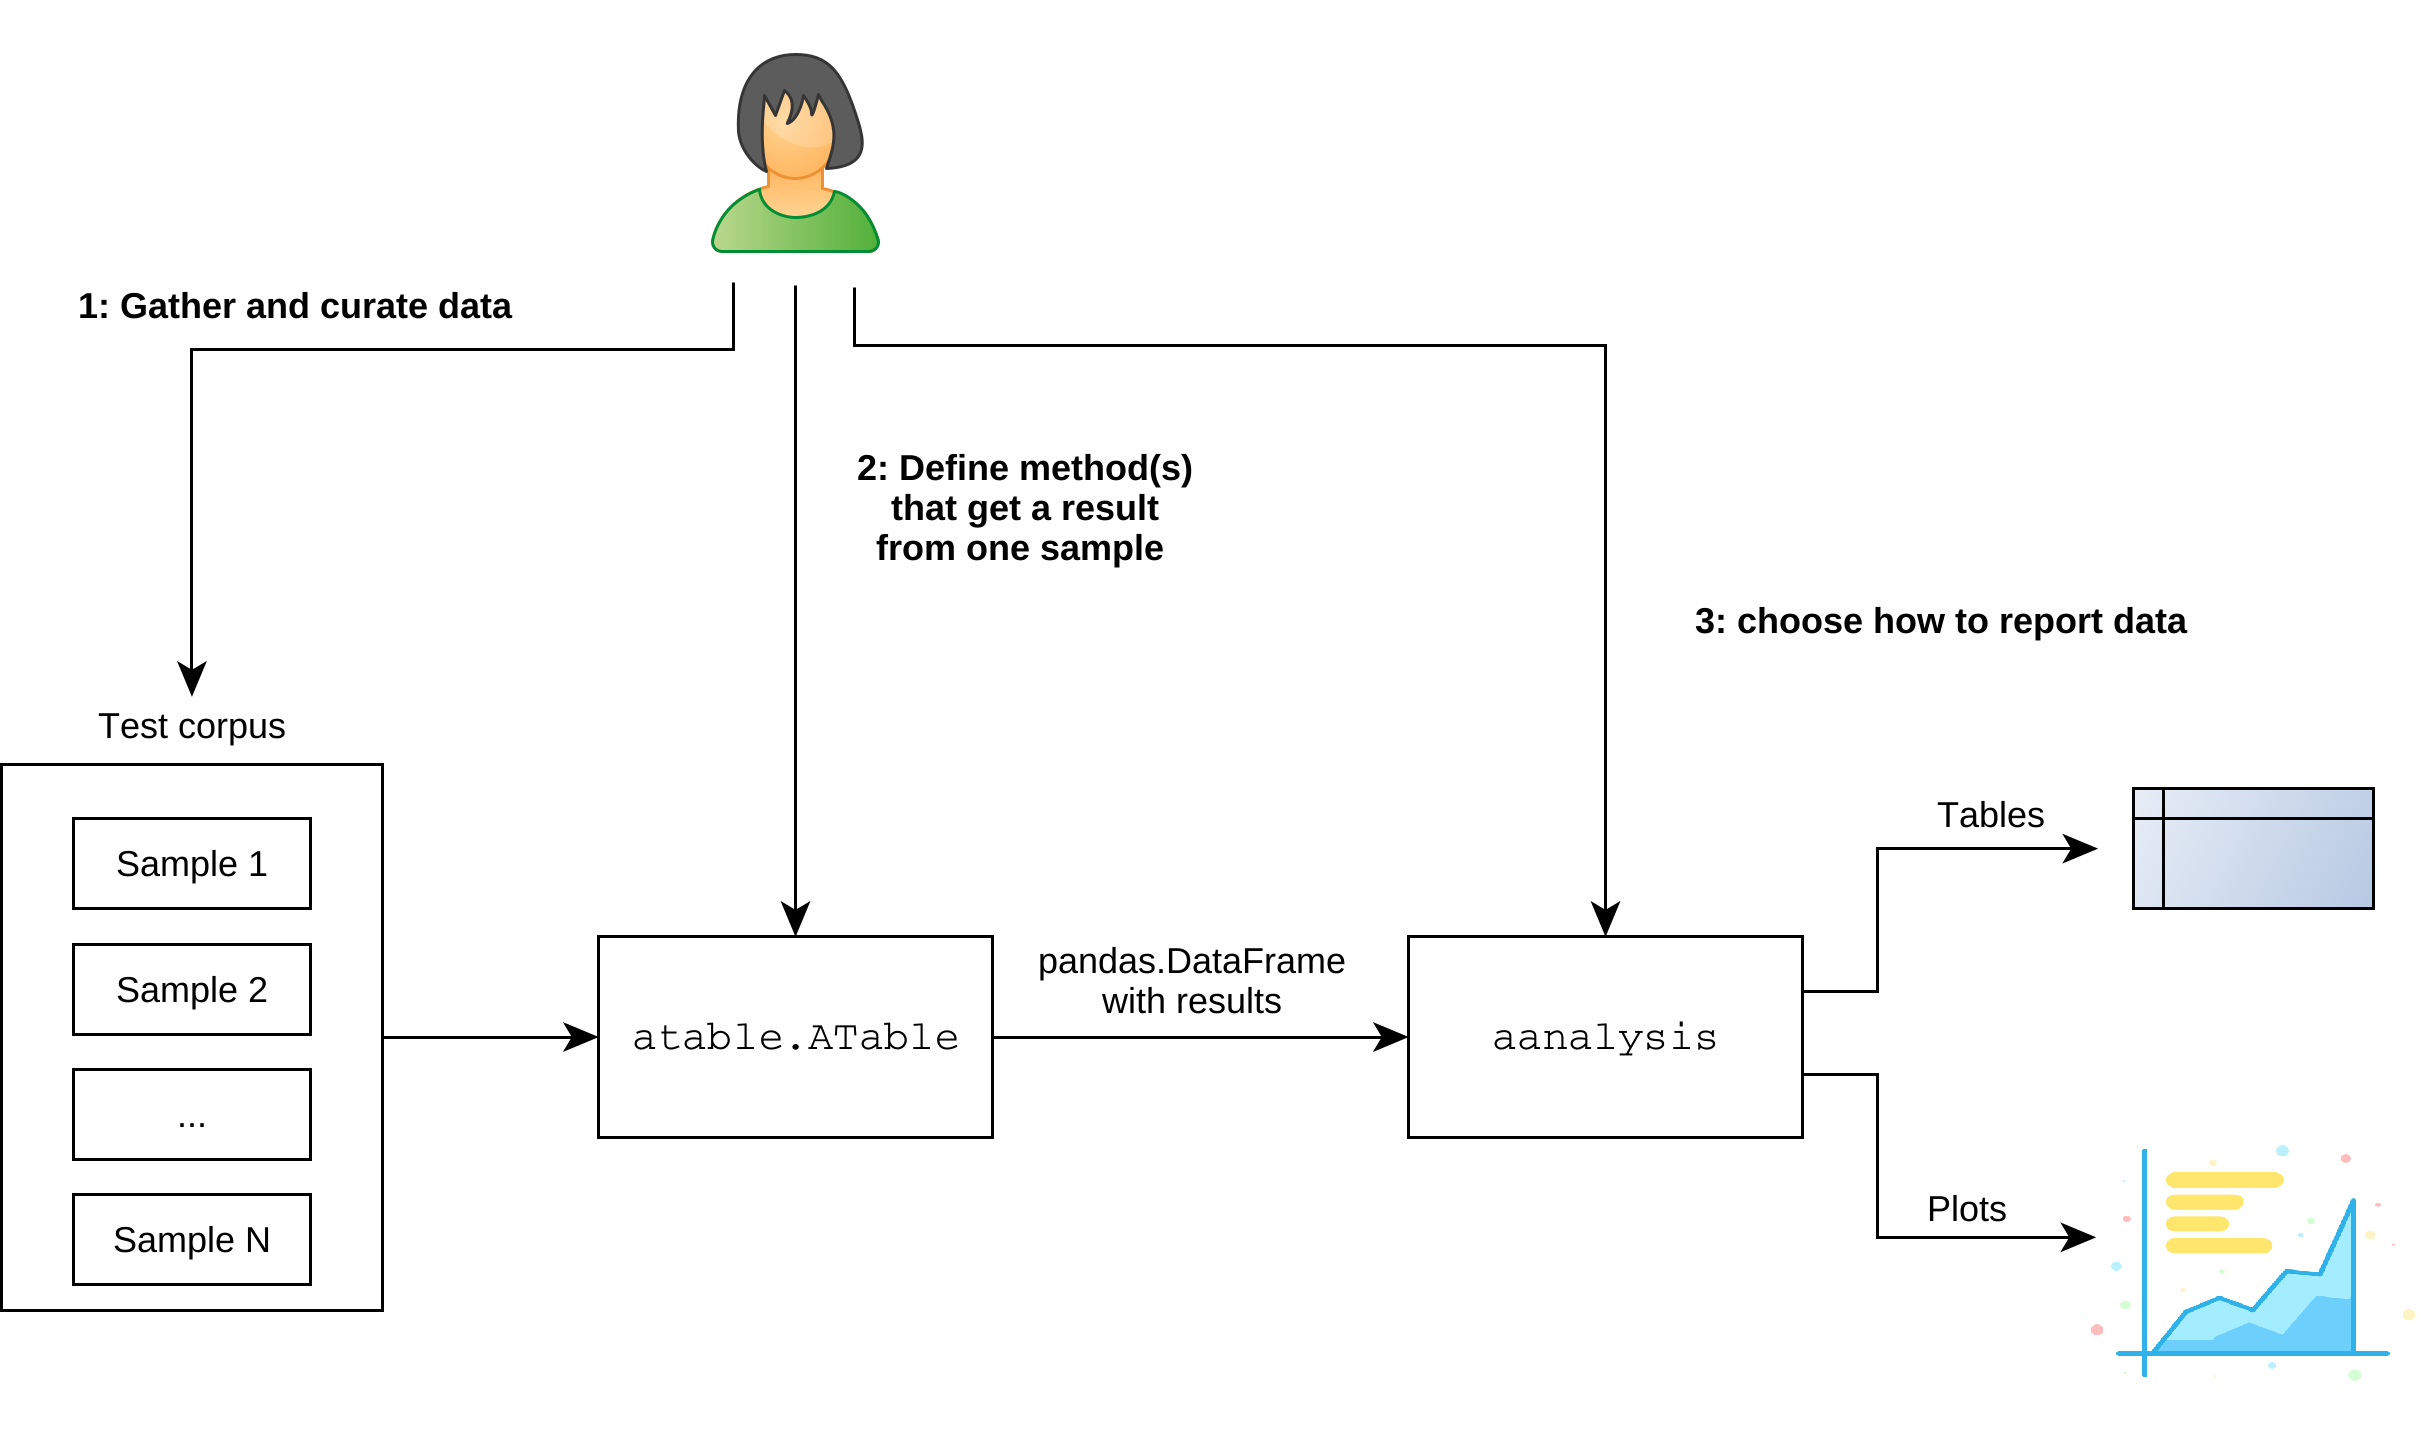
Basic steps when using enb with an enb.atable.ATable subclass.
1 - Data curation
The first step is to gather and curate your data samples. For instance, if you work in image processing, each sample could be one of your test images, if you work with genetic sequences, each file could be one sequence, etc.
Note
It is best practice to separate data samples from test parameters, e.g., arguments to the algorithm(s) used to process each of your samples. A good way to define parameter sets is through the
enb.experiment.Experimentandenb.experiment.ExperimentTaskclasses, covered later in the documentation.
In this basic example, each sample is the text source of a Wikipedia article. We have the following files under the ./data/wiki/ folder:
a_turing.txt
c_shannon.txt
d_knuth.txt
k_popper.txt
m_curie.txt
n_chomsky.txt
r_franklin.txt
s_beauvoir.txt
scientific_method.txt
We will want to tell enb that these are our input
One can gather all such input samples with a single line (after import glob):
sample_paths = glob.glob("./data/wiki/*.txt")
For now our test dataset is all set!
2 - Simple column definition
The second step consists in defining the column functions(s) that produce the desired results.
With enb you decide what columns (fields) are computed for each input. Results for each input
are then automatically stored in a different row per input.
The easiest way is to define a custom column is to inherit from enb.atable.ATable and
define a def column_XYZ(self, index, row) method, where XYZ is the name of your
column. That method should process the input index (in this example, the path to a .txt file)
and return the value of XYZ for that input.
For instance,
class WikiTable(enb.atable.ATable):
    def column_line_count(self, index, row):
        """Computes the number of lines in the input .txt file.
        """
        with open(index, "r") as input_file:
            return sum(1 for line in input_file)
creates a WikiTable class that contains a line_count column. This is all we need for now.
3 - Retrieving a results table
At this point we are ready to retrieve our table of results. To do so, we call the get_df method
from enb.atable.ATable subclasses such as the WikiTable class we just defined:
result_df = WikiTable().get_df(target_indices=sample_paths)
Here, result_df is a pandas.DataFrame instance contains one row per element in sample_paths.
The enb provides tools for analyzing and plotting results for columns you define.
Notwithstanding, you can use result_df directly as the full-fledged pandas dataframe it is.
For instance, you can access and print the line_count column as follows:
print(result_df[["index", "line_count"]])
Which should produce something similar to the following (ignoring the private column __atable_index):
                     index  line_count
   ./data/wiki/d_knuth.txt         373
./data/wiki/s_beauvoir.txt         292
 ./data/wiki/c_shannon.txt         343
   ./data/wiki/m_curie.txt         538
./data/wiki/r_franklin.txt         419
  ./data/wiki/a_turing.txt         430
 ./data/wiki/n_chomsky.txt        1854
  ./data/wiki/k_popper.txt         533
4 - Data analysis and plotting
Once you have your result dataframe after calling get_df, there are several ways to analyze and plot them:
You can use
enb.aanalysis.Analyzersubclasses from theenb.aanalysismodule. This is the fastest way and the best integrated with enb. This documentation provides help for almost exclusively this way of analysis and plotting.You can combine pandas/numpy/matplotlib/seaborn manually to perform your own analysis. The enb library does this internally for you, but this will give you total control with the default interfaces of these libraries.
It is also possible to export your data in CSV and employ other tools such as R/SPSS/Office to conduct your analysis.
In all cases, the result dataframe may be further manipulated if needed,
e.g., using pandas’ grouping and selection interface. For instance, rows with certain values in a column
may need to be discarded from the analysis.
Using approach (1) above, i.e., pure enb, there are several tools at your avail
to analyze and report one or more data columns from a dataframe returned by enb.atable.ATable’s get_df method.
Note
The Result analysis and plotting with enb page provides detailed information on how to analyze and plot different types of data with
enb, using theenb.aanalysismodule.You can use
enb.aanalysistools also forpandas.DataFrameinstances obtained frompandas.DataFrameinstances directly obtained from CSV files (e.g., produced by some other tool).
The most basic automatic analyzer is enb.aanalysis.ScalarNumericAnalyzer.
By default, it produces an histogram of the values of a given data column, in addition to average values
and +/- 1 standard deviation error bars. The following example shows how to show a basic
plot related to the line_count column defined above.
# Generate plots and analysis dataframe.
analysis_df = enb.aanalysis.ScalarNumericAnalyzer().get_df(
    full_df=result_df,
    target_columns=["line_count"])

# Save analysis dataframe to CSV.
os.makedirs("analysis", exist_ok=True)
analysis_df.to_csv("analysis/line_count_analysis.csv")
You can download the resulting figure.
Note
full_dfis thepandas.DataFrameinstance produced byenb.atable.ATable.
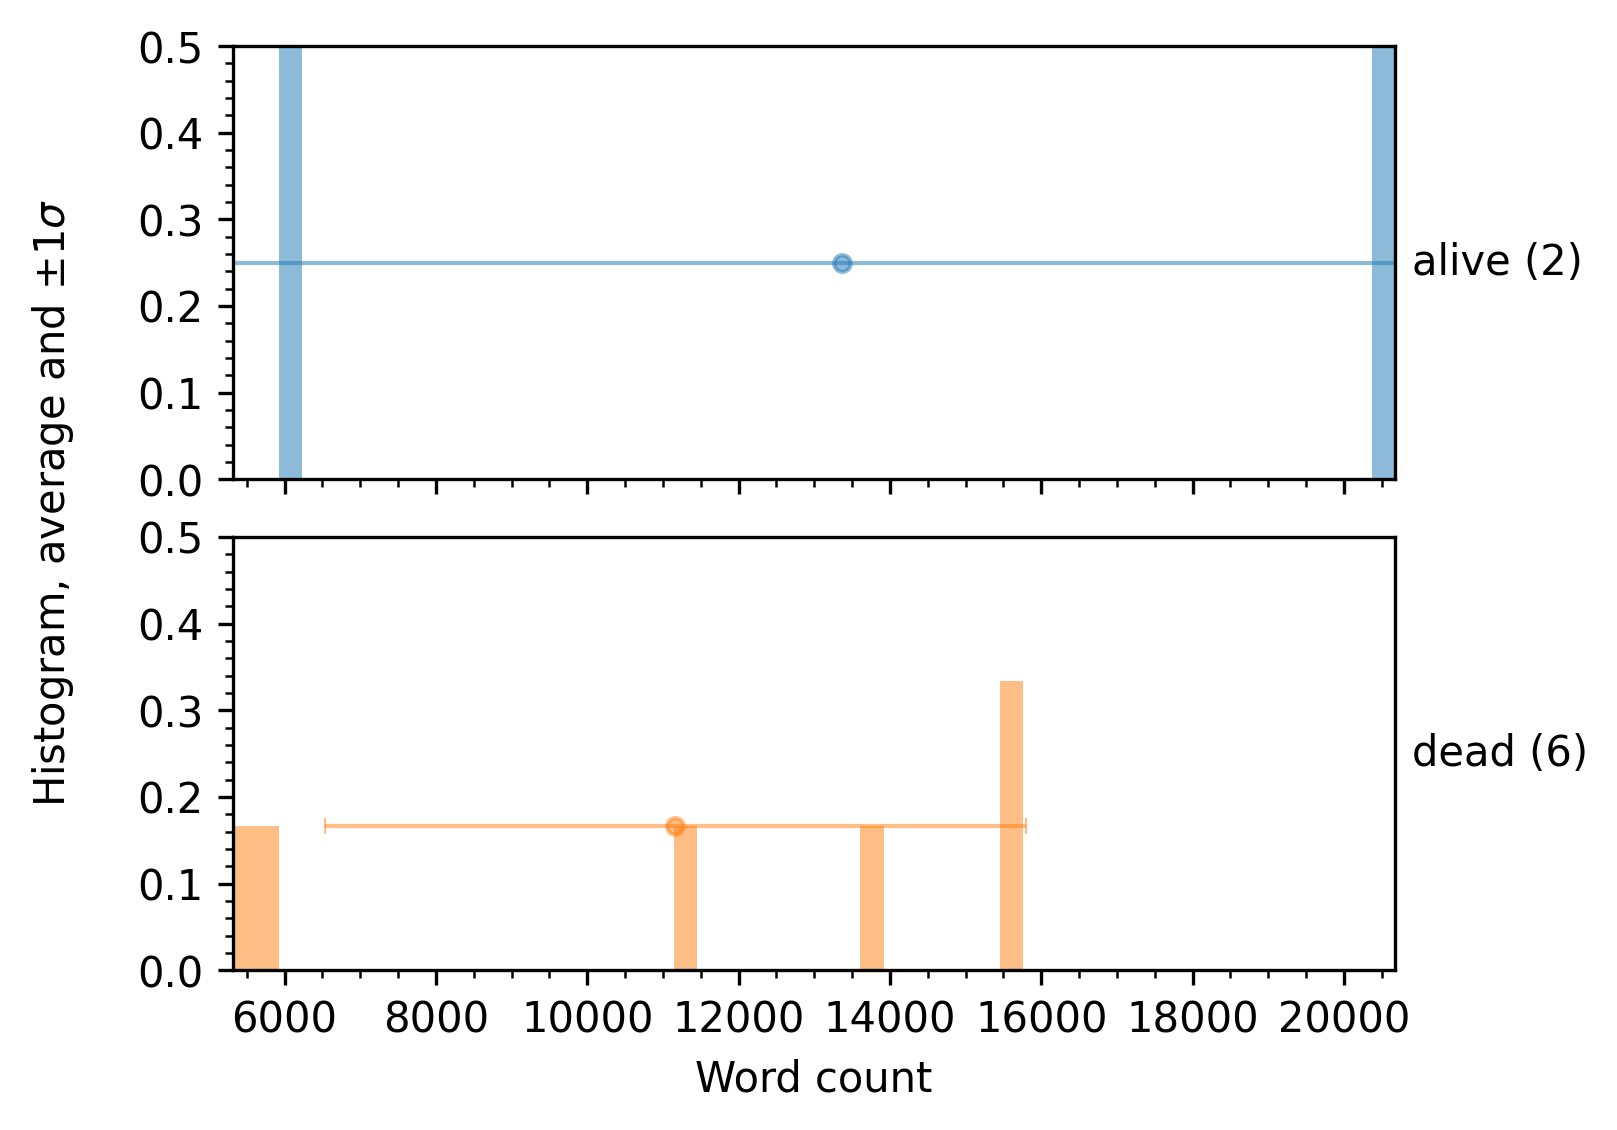
Note that several grouping options are available when reporting data. For instance, you can use the name of a column to split the full dataframe into subgroups based on the value of that column.
For instance,
if the status column is defined in the WikiTable class of our example as follows,
@enb.atable.column_function(enb.atable.ColumnProperties("status"))
def set_dead_person(self, file_path, row):
  with open(file_path, "r") as input_file:
     row[_column_name] = "dead" if "death_place" in input_file.read() else "alive"
then one can make a grouped analysis with the following code snippet:
scalar_analyzer.analyze_df(
        full_df=result_df,
        target_columns=["word_count"],
        group_by="status")
A sample plot produced by this full script is shown next.
5 - Adding more columns
So far, our WikiTable class has defined a single column of information, that is computed
for each input index. Each input index is then stored in its own row.
You can extend your enb.atable.ATable subclasses with as many columns as needed.
To do so you can inherit from other enb.atable.ATable classes, and/or define new columns.
To inherit all columns defined in, e.g., WikiTable, regular python inheritance is sufficent. For instance, the following class NewWikiTable automatically contains all columns defined for WikiTable:
class NewWikiTable(WikiTable):
   def column_new_data(self, index, row):
       # ...
To define custom columns for your class, you can add column_* methods
to your enb.atable.ATable subclass as in Section 2, or you can use the @enb.atable.column_function decorator
as in the following example:
class WikiTable(enb.atable.ATable):
    # Methods that start with column_ are automatically recognized as such.
    # They just need to return the intended value.
    def column_line_count(self, file_path, row):
        with open(file_path, "r") as input_file:
            return sum(1 for line in input_file)

    # More information about a column can be provided
    # Several column names and/or enb.atable.ColumnProperties instances
    # can also be passed as *args to the decorator to define multiple columns
    @enb.atable.column_function(
        enb.atable.ColumnProperties(name="word_count", label="Word count", plot_min=0),
        "status")
    def set_word_count(self, file_path, row):
        with open(file_path, "r") as input_file:
            contents = input_file.read()
            row["word_count"] = len(contents.split())
            row["status"] = "dead" if "death_place" in contents.lower() else "alive"
The @enb.atable.column_function decorator is the most general way of defining new columns. In general, to employ it:
Define a method
fwith interfacef(self, file_path, row). Thefile_pathargument is the path to one test sample (e.g.,./data/wiki/s_beauvoir.txt. Therowargument is a dict-like instance, into which the desired result (for this input sample) is to be stored.Decorate the method with
@enb.atable.column_function(column_name), wherecolumn_nameis a unique name that identifies the result produced by the method.It is not recommended to decorate functions with name starting with column_.
Methods decorated with @enb.atable.column_function should not return the computed value, but instead assign it to its row argument, i.e., they should update the current row directly.
Note
The
enb.atable.column_functiondecorator acceptsenb.atable.ColumnPropertiesinstances. These column properties describe not only the unique name for the data column, but also other information useful for reporting the obtained results.The _column_name global is defined whenever a
column_function-decorated method is called, containing the unique column name being computed. The use of this global is totally optional, but enables less error-prone column renaming.
Putting everything together, here’s the full source code of this basic workflow example:
import os
import glob
import shutil
import enb.atable
import enb.aanalysis


class WikiTable(enb.atable.ATable):
    # Methods that start with column_ are automatically recognized as such.
    # They just need to return the intended value.
    def column_line_count(self, file_path, row):
        with open(file_path, "r") as input_file:
            return sum(1 for line in input_file)

    # More information about a column can be provided
    # Several column names and/or enb.atable.ColumnProperties instances
    # can also be passed as *args to the decorator to define multiple columns
    @enb.atable.column_function(
        enb.atable.ColumnProperties(name="word_count", label="Word count", plot_min=0),
        "status")
    def set_word_count(self, file_path, row):
        with open(file_path, "r") as input_file:
            contents = input_file.read()
            row["word_count"] = len(contents.split())
            row["status"] = "dead" if "death_place" in contents.lower() else "alive"


def main():
    # Step 1: get a list of all data samples
    sample_paths = glob.glob("./data/wiki/*.txt")

    # Step 2: run experiment to gather data
    table = WikiTable() # csv_support_path="persistence_basic_workflow.csv")
    result_df = table.get_df(target_indices=sample_paths)

    # Show part of the returned table for the documentation.
    print(result_df[["index", "line_count"]])


    # Step 3: plot results
    #   Distribution of line counts
    analysis_df = enb.aanalysis.ScalarNumericAnalyzer().get_df(
        full_df=result_df,
        target_columns=["line_count"])
    os.makedirs("analysis", exist_ok=True)
    analysis_df.to_csv("analysis/line_count_analysis.csv")

    #   Distribution of word count grouped by status
    analysis_df = enb.aanalysis.ScalarNumericAnalyzer().get_df(
        full_df=result_df,
        target_columns=["word_count"],
        group_by="status",
        show_global=False)
    os.makedirs("analysis", exist_ok=True)
    analysis_df.to_csv("analysis/word_count_analysis.csv")

    #   Scatter plot: line count vs word count
    enb.aanalysis.TwoNumericAnalyzer().get_df(
        full_df=result_df,
        target_columns=[("line_count", "word_count")],
        column_to_properties=table.column_to_properties)

    # Render a PNG version as well
    shutil.rmtree("plots_png", ignore_errors=True)
    enb.aanalysis.pdf_to_png("plots", "plots_png")


if __name__ == '__main__':
    main()