Lossy Compression Experiment
This page explains the general dynamics of using the enb.icompression.LossyCompressionExperiment class.
This class is a subclass of enb.icompression.CompressionExperiment, which performs compression, decompression
and computes several distortion metrics on the reconstructed images (compared to the originals).
Lossy compression template installation
Example code that serves as template for your lossy compression experiments can be installed via the following command line command:
enb plugin install lossy-compression lc
In addition, we are going to install some lossy codecs from the ones listed with enb plugin list codec. Namely, JPEG-LS and the Versatile Video Coder (VVC). These can be easily installed as enb plugins. Please be patient with the installation, which compiles both tools from source:
enb plugin install jpeg lc/plugins/jpeg;
enb plugin install vvc lc/plugins/vvc
Dataset curation
The same process of dataset curation as in Lossless Compression Experiment must be followed. In the template, a small sample is provide under ./datasets/ for ease of reference.
Codec and TaskFamily instantiation
As for enb.icompression.LosslessCompressionExperiment , we want to define a list of codecs.
In this case, we will normally normally use subclasses of enb.icompression.LossyCodec and enb.icompression.NearLosslessCodec.
In addition, to facilitate analysis and plotting, we will be defining families of codecs. To do so, we instantiate the class:enb.experiment.TaskFamily class and add the names of our codecs for each family as follows.
import enb
import plugins

# Define the JPEG-LS family
jpegls_family = enb.experiment.TaskFamily("JPEG-LS")
for max_error in range(2, 17):
    codec = plugins.jpeg.JPEG_LS(max_error=max_error)
    jpegls_family.add_task(codec.name, codec.label)
    codecs.append(codec)
task_families.append(jpegls_family)

# Define the VVC family
vvc_family = enb.experiment.TaskFamily("VVC")
for qp in range(1, 52, 3):
    codec = plugins.vvc.VVC_lossy(qp=qp)
    vvc_family.add_task(codec.name, codec.label)
    codecs.append(codec)
task_families.append(vvc_family)
Lossy experiment execution
The lossless_compression_experiment.py template is now ready to be run. To do so, simply invoke it with:
python ./lc/lossy_compression_experiment_example.py
This should produce the plots, analysis folders. Furthermore, a persistence_lossy_compression_experiment_example.py folder is created with persistence information, so that images do not need to be analyzed again, and that compression needs not be performed again unless you add any new codecs to your experiment.
If you check the code, you will see that the following two lines are responsible for the actual experiment execution
exp = LossyExperiment(codecs=codecs, task_families=task_families)
df = exp.get_df()
Lossy result analysis and plotting
The remainder of the template is devoted to plotting results returned in the pandas.DataFrame df.
You can check
the Result analysis and plotting with enb page for more information on how to analyze and plot
results with enb.
# Selection of potentially relevant columns.
# You can use any of the columns available in
# the experiment class (including any column you defined,
# e.g., in the LossyExperiment class above).
scalar_columns = [
"compression_ratio_dr",
"bpppc",
"compression_efficiency_1byte_entropy",
"compression_time_seconds",
"decompression_time_seconds",
"pae",
"psnr_bps", "psnr_dr"]
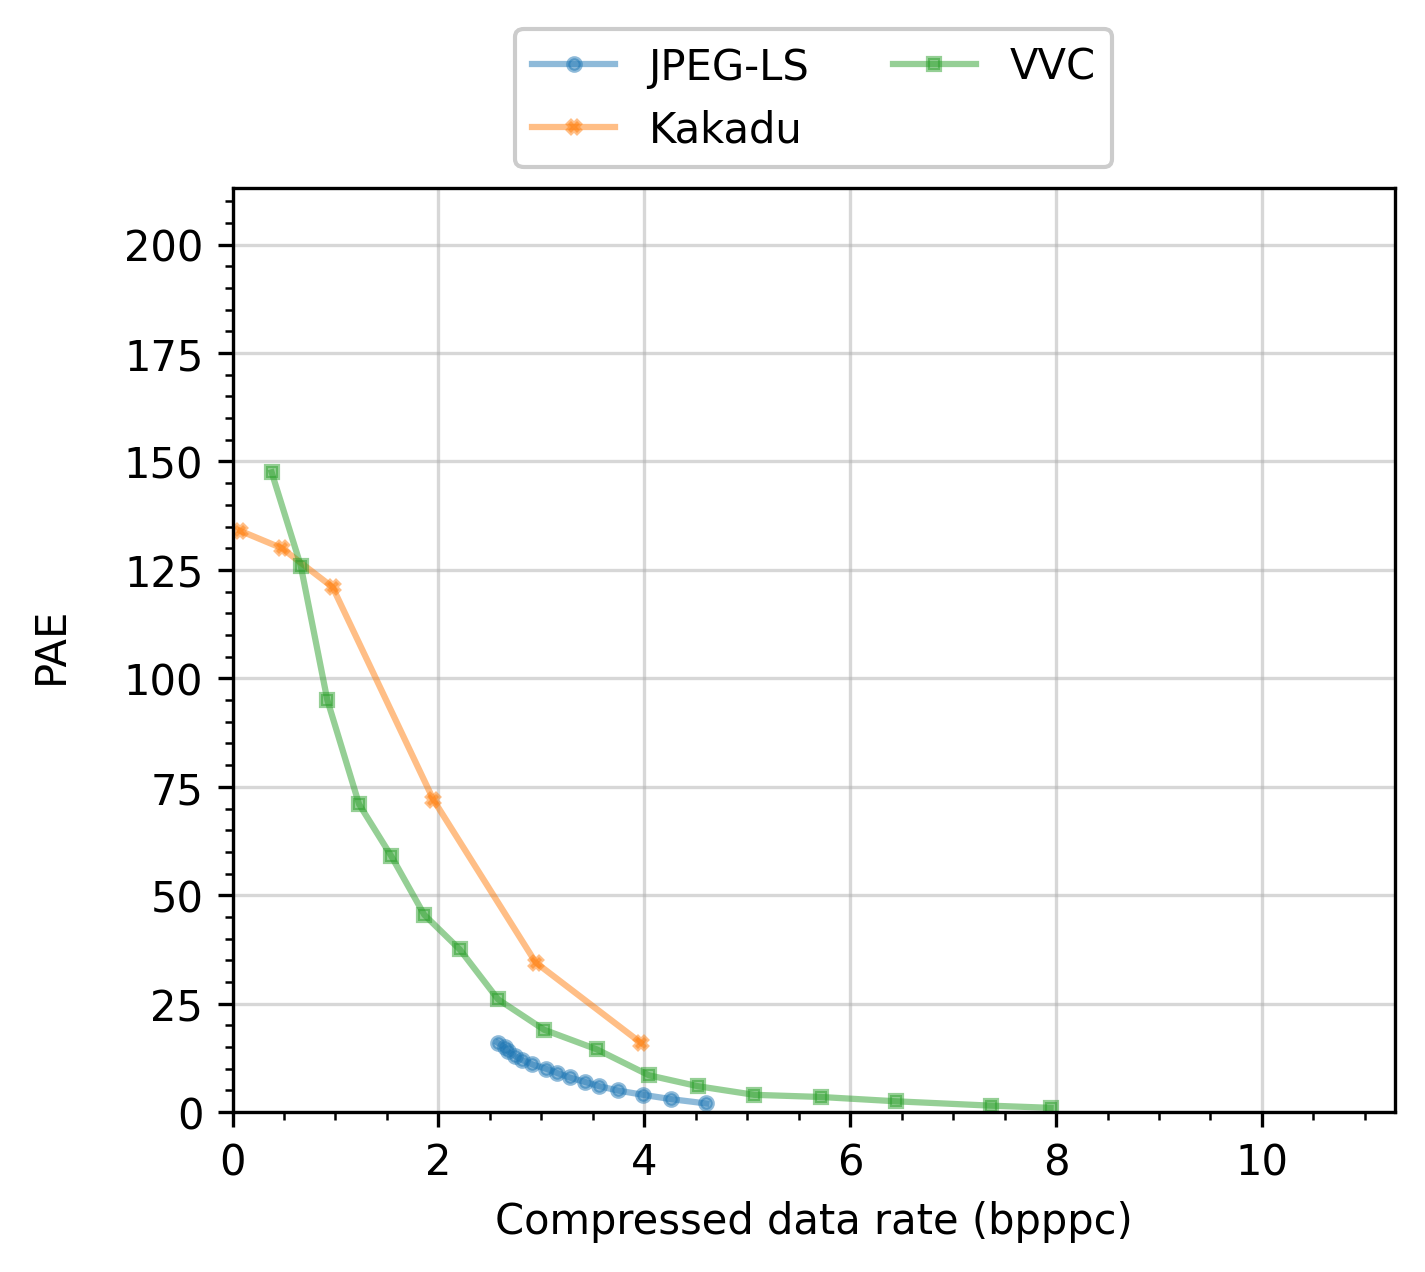
column_pairs = [
("bpppc", "pae"),
("bpppc", "psnr_dr"),
("bpppc", "compression_time_seconds"),
("bpppc", "decompression_time_seconds"),
]
# Scalar column analysis
scalar_analyzer = enb.aanalysis.ScalarNumericAnalyzer(
csv_support_path=os.path.join(
options.analysis_dir,
"analysis_lossy/",
"lossy_compression_analysis_scalar.csv"))
scalar_analyzer.show_x_std = True
scalar_analyzer.sort_by_average = True
scalar_analyzer.show_individual_samples = False
scalar_analyzer.show_global = False
plot_dir = os.path.join(os.path.dirname(os.path.abspath(__file__)), "plots", "plots_lossy")
column_properties = exp.joined_column_to_properties
column_properties["pae"].plot_max = 10
scalar_analyzer.get_df(
full_df=df,
target_columns=scalar_columns,
column_to_properties=exp.joined_column_to_properties,
group_by="task_label",
selected_render_modes={"histogram"},
output_plot_dir=plot_dir,
fig_height=8,
show_grid=True,
)
twoscalar_analyzer = enb.aanalysis.TwoNumericAnalyzer(
csv_support_path=os.path.join(
options.analysis_dir,
"analysis_lossy/",
"lossy_compression_analysis_twocolumn.csv"))
twoscalar_analyzer.show_individual_samples = False
twoscalar_analyzer.show_global = False
twoscalar_analyzer.get_df(
full_df=df,
target_columns=column_pairs,
column_to_properties=exp.joined_column_to_properties,
group_by=task_families,
selected_render_modes={"line"},
output_plot_dir=plot_dir,
show_grid=True,
)
An example plot produced by this experiment, e.g., the compressed data rate in bits per sample, is shown in the next figure:
Saving the compressed and/or reconstructed files
Just like with lossless compression experiments, one can easily copy all compressed and/or reconstructed files processed during the execution of a compression experiment. You simply need to add the compressed_copy_dir_path and/or the reconstructed_dir_path arguments to the constructor of your CompressionExperiment, e.g.:
exp = enb.icompression.LossyCompressionExperiment(codecs=codecs,
                                                  compressed_copy_dir_path="compressed/",
                                                  reconstructed_dir_path="reconstructed/")